


PHP断点调试
最近因为要查看php程序的源码, 但是都是静态的PHP代码页, 完全无法搞清楚逻辑, 所以使用想到了php断点调试
环境准备
1: phpStrom版本2017.2.4
2: wamp三件套,版本2.5
1:修改wamp的php设置, 左键wamp,在弹窗选择PHP---》》php settings ---》》xdebug, 把所有的xDebug选项都勾选上;
2:打开wamp的php.ini配置文件,在最后加上代码,路径配置是不同的, 要根据wamp的安装路径进行修改:
; XDEBUG Extension

zend_extension = "d:/wamp-new/bin/php/php5.5.12/zend_ext/php_xdebug-2.2.5-5.5-vc11.dll"
;
[xdebug]
xdebug.remote_enable = off
xdebug.profiler_enable = off
xdebug.profiler_enable_trigger = off
xdebug.profiler_output_name = cachegrind.out.%t.%p
xdebug.profiler_output_dir = "d:/wamp-new/tmp"
xdebug.show_local_vars=0
xdebug.idekey=PhpStorm
xdebug.remote_enable = On
xdebug.remote_host=localhost
xdebug.remote_port=9000
xdebug.remote_handler=dbgp
3: 判断xdebug是否加载,在wamp的www目录下,创建php文件, 使用phpinfo()函数 进行查看
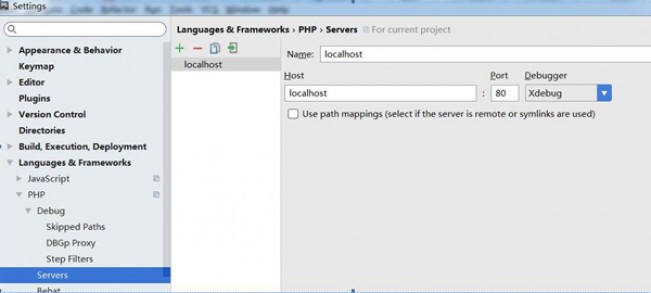
4:phpStrom-->> File->Settings->Languages&Frame Works->Php->Servers 配置服务器相关设置:
Name:localhost
Host:localhost
Port:80
Debugger: Xdebug
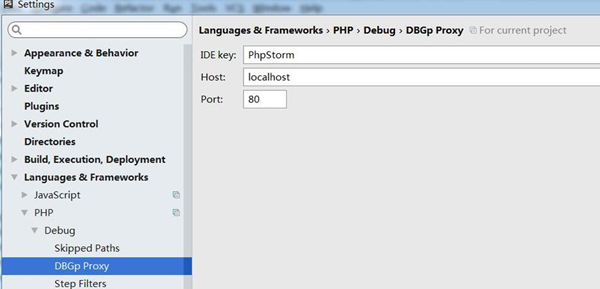
5:File->Settings->Languages&Frame Works->Php->Debug->DBGp Proxy 配置相关设置:
Ide key: phpstorm
host: localhost
port: 80
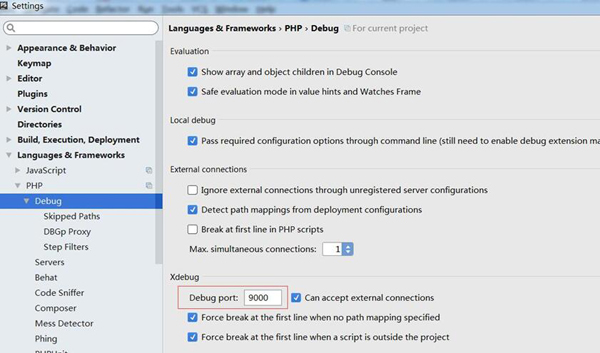
6 :File->Settings->Languages&Frame Works->Php-Debug 找到右边窗口对应的debug设置,把端口改成9000
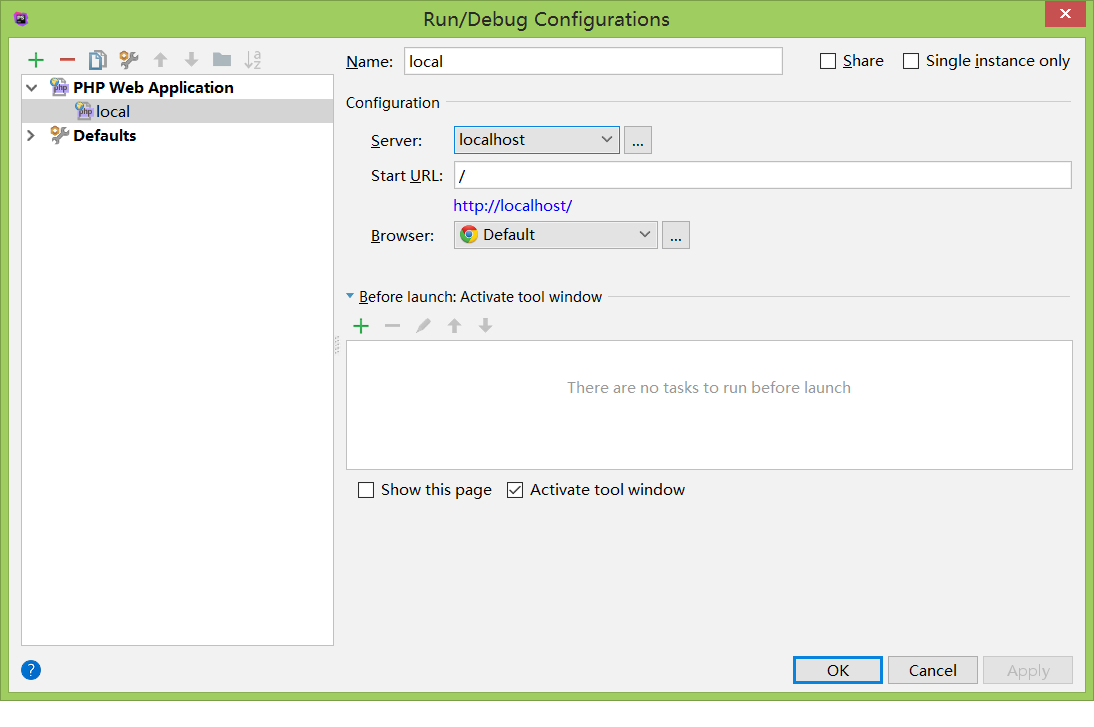
7:在项目右上角debug配置中,edit configurations创建一新的配置:
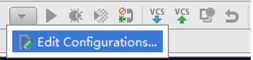
8: name可以随便填, server选择localhost, 浏览器就选择chrome浏览器:
9:使用phpStrom打开php项目,在 php代码的前面下断点, 选择右上角的小虫子,chrome浏览器会打开这个php文件, 断点下断成功
10:F7单步进入, F8单步跳过, F9运行
 作者: NONO
出处:http://www.cnblogs.com/diligenceday/
企业网站:http://www.idrwl.com/
开源博客:http://www.github.com/sqqihao
QQ:287101329
微信:18101055830


